

Introduction
When sourcing or specifying RO reverse osmosis water purification systems for commercial, industrial, or OEM applications, one key metric frequently appears at the top of the datasheet: wastewater ratio.
Marketing materials often tout figures like "2:1," "3:1," or even "ultra-low wastewater." But many assume this is a fixed, guaranteed performance parameter.
In reality, the wastewater ratio of an RO system is a dynamic outcome—not a static specification.
For procurement professionals, brand managers, and systems integrators, understanding the following is essential:
-
How the wastewater ratio is actually adjusted
-
Why it fluctuates from day to day
-
How it performs in real-world conditions versus laboratory settings
These insights are critical for making informed purchasing decisions, evaluating supplier claims, and managing long-term operating costs.
This technical guide covers:
-
The mechanisms behind wastewater ratio adjustment in RO systems
-
A comparison of manual vs. intelligent control methods
-
Why real-world performance deviates from laboratory data
-
A practical evaluation framework for B2B buyers
-
Application-specific recommendations for different use cases
What Determines the Wastewater Ratio?
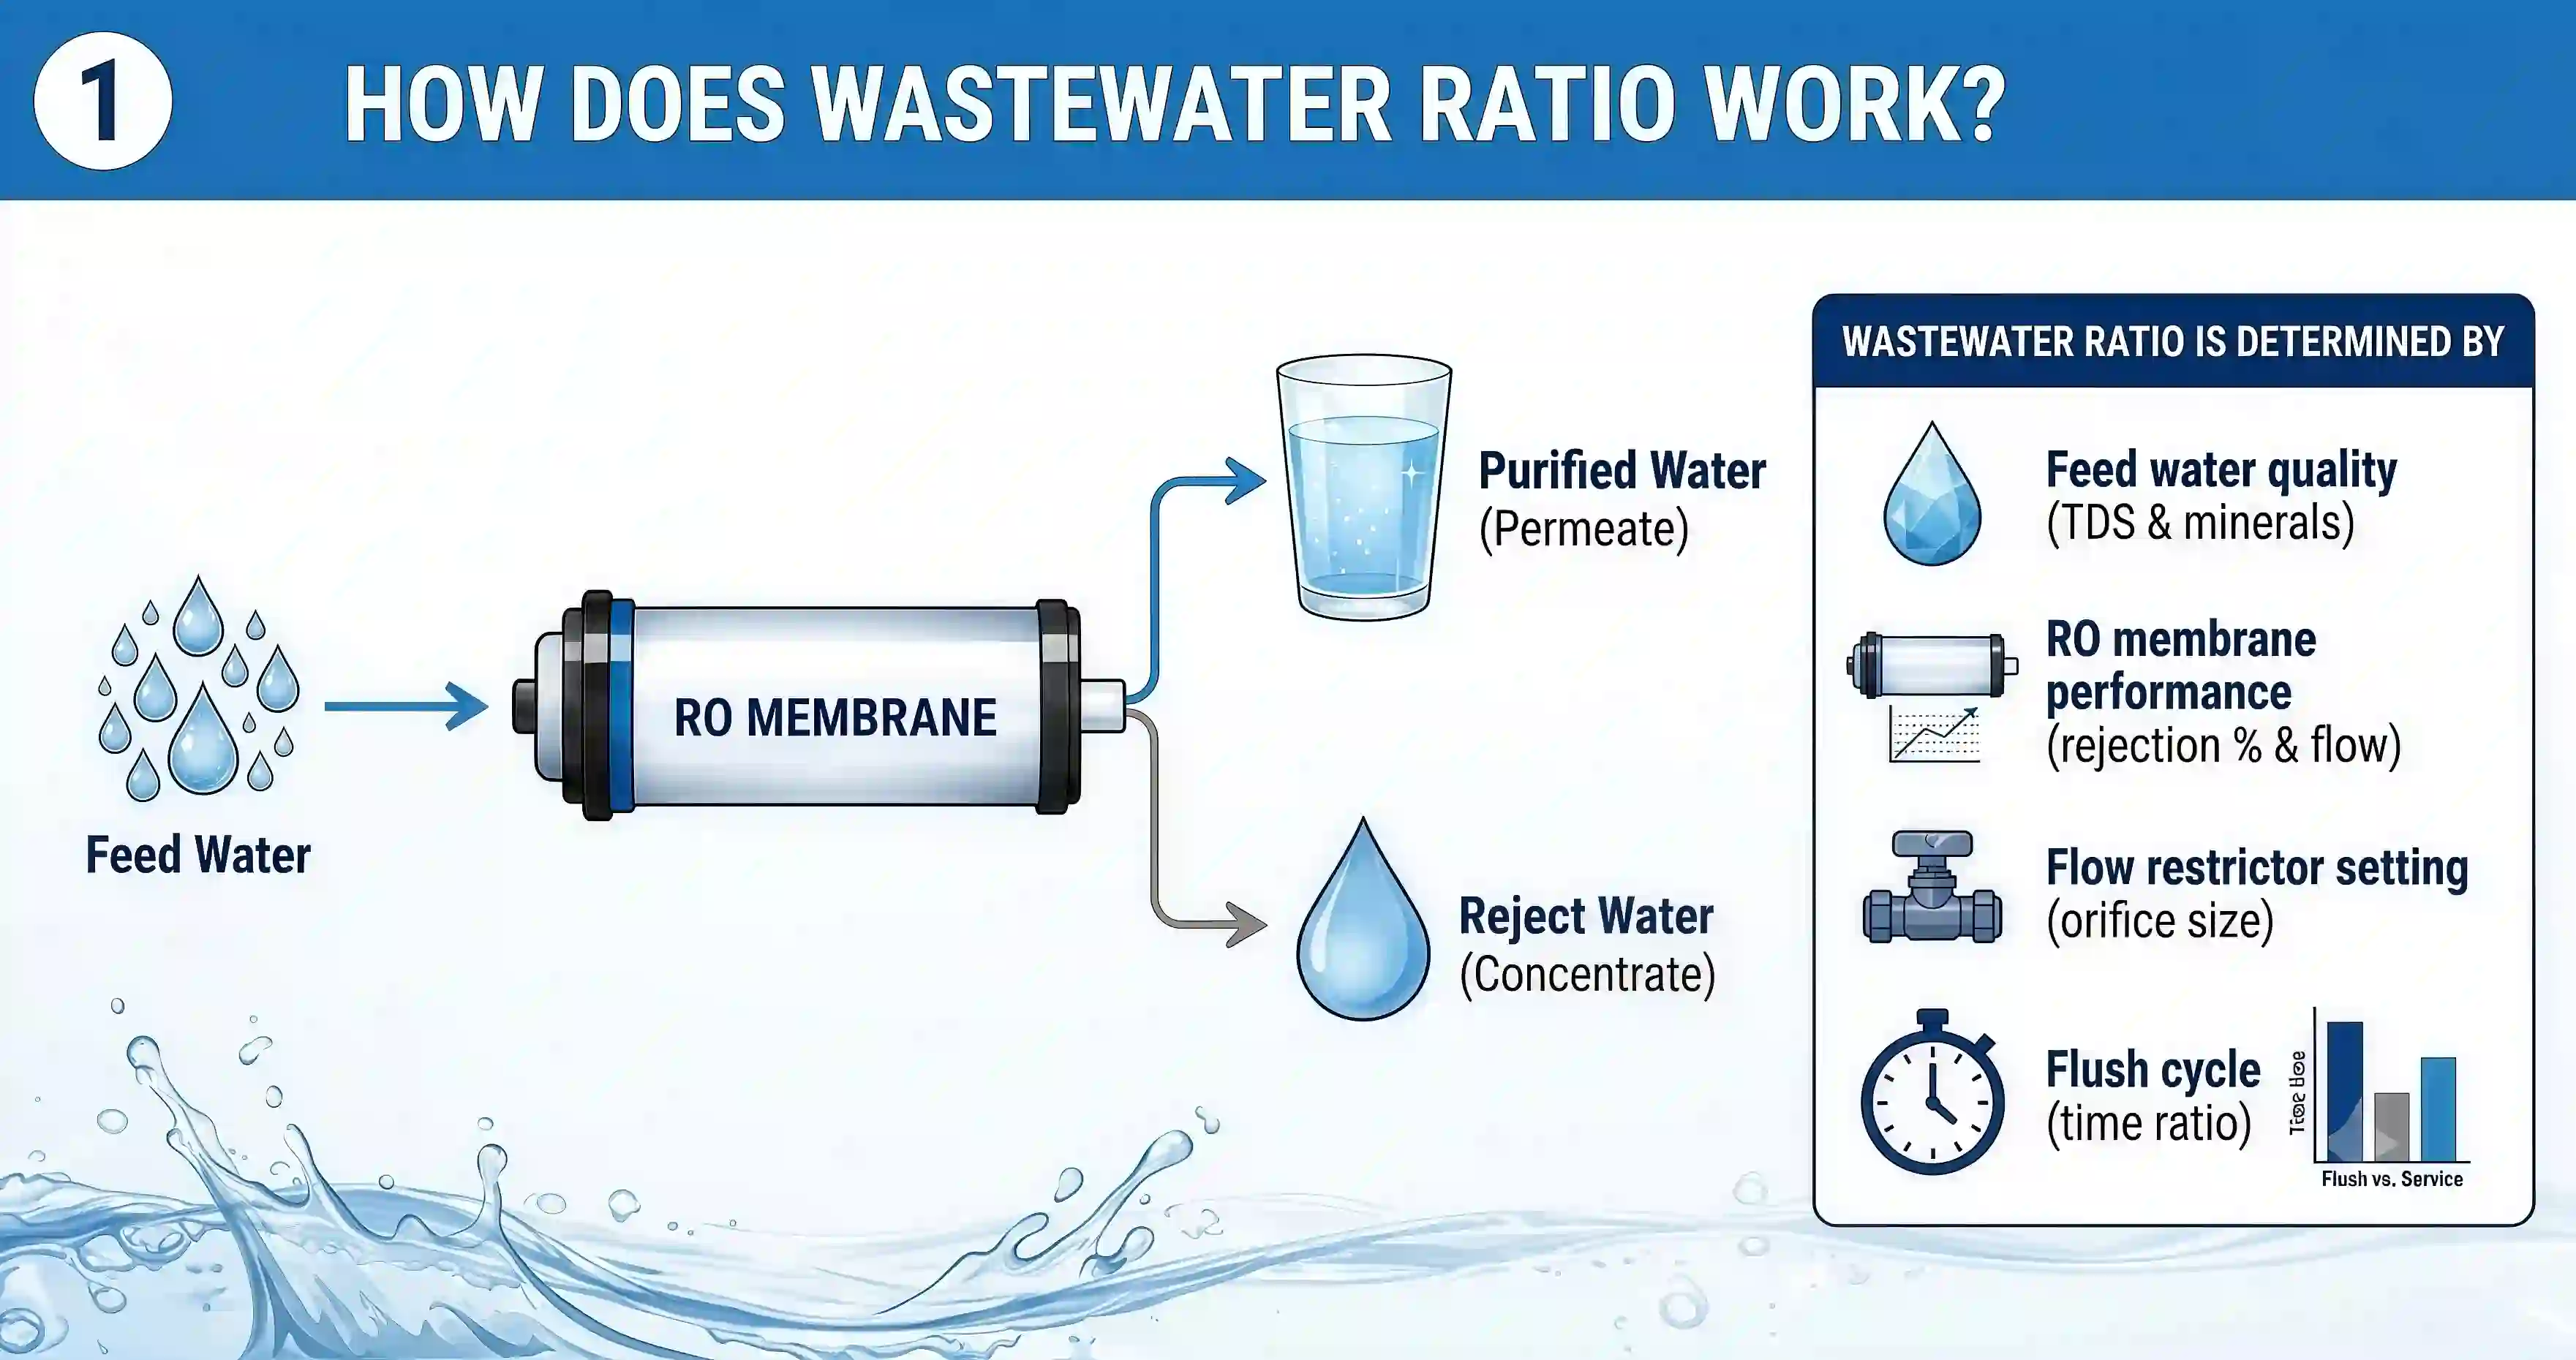
Contrary to common belief, the wastewater ratio is not a single parameter that can be simply "dialed in."
It emerges from the interaction of multiple hardware and electronic components working together.
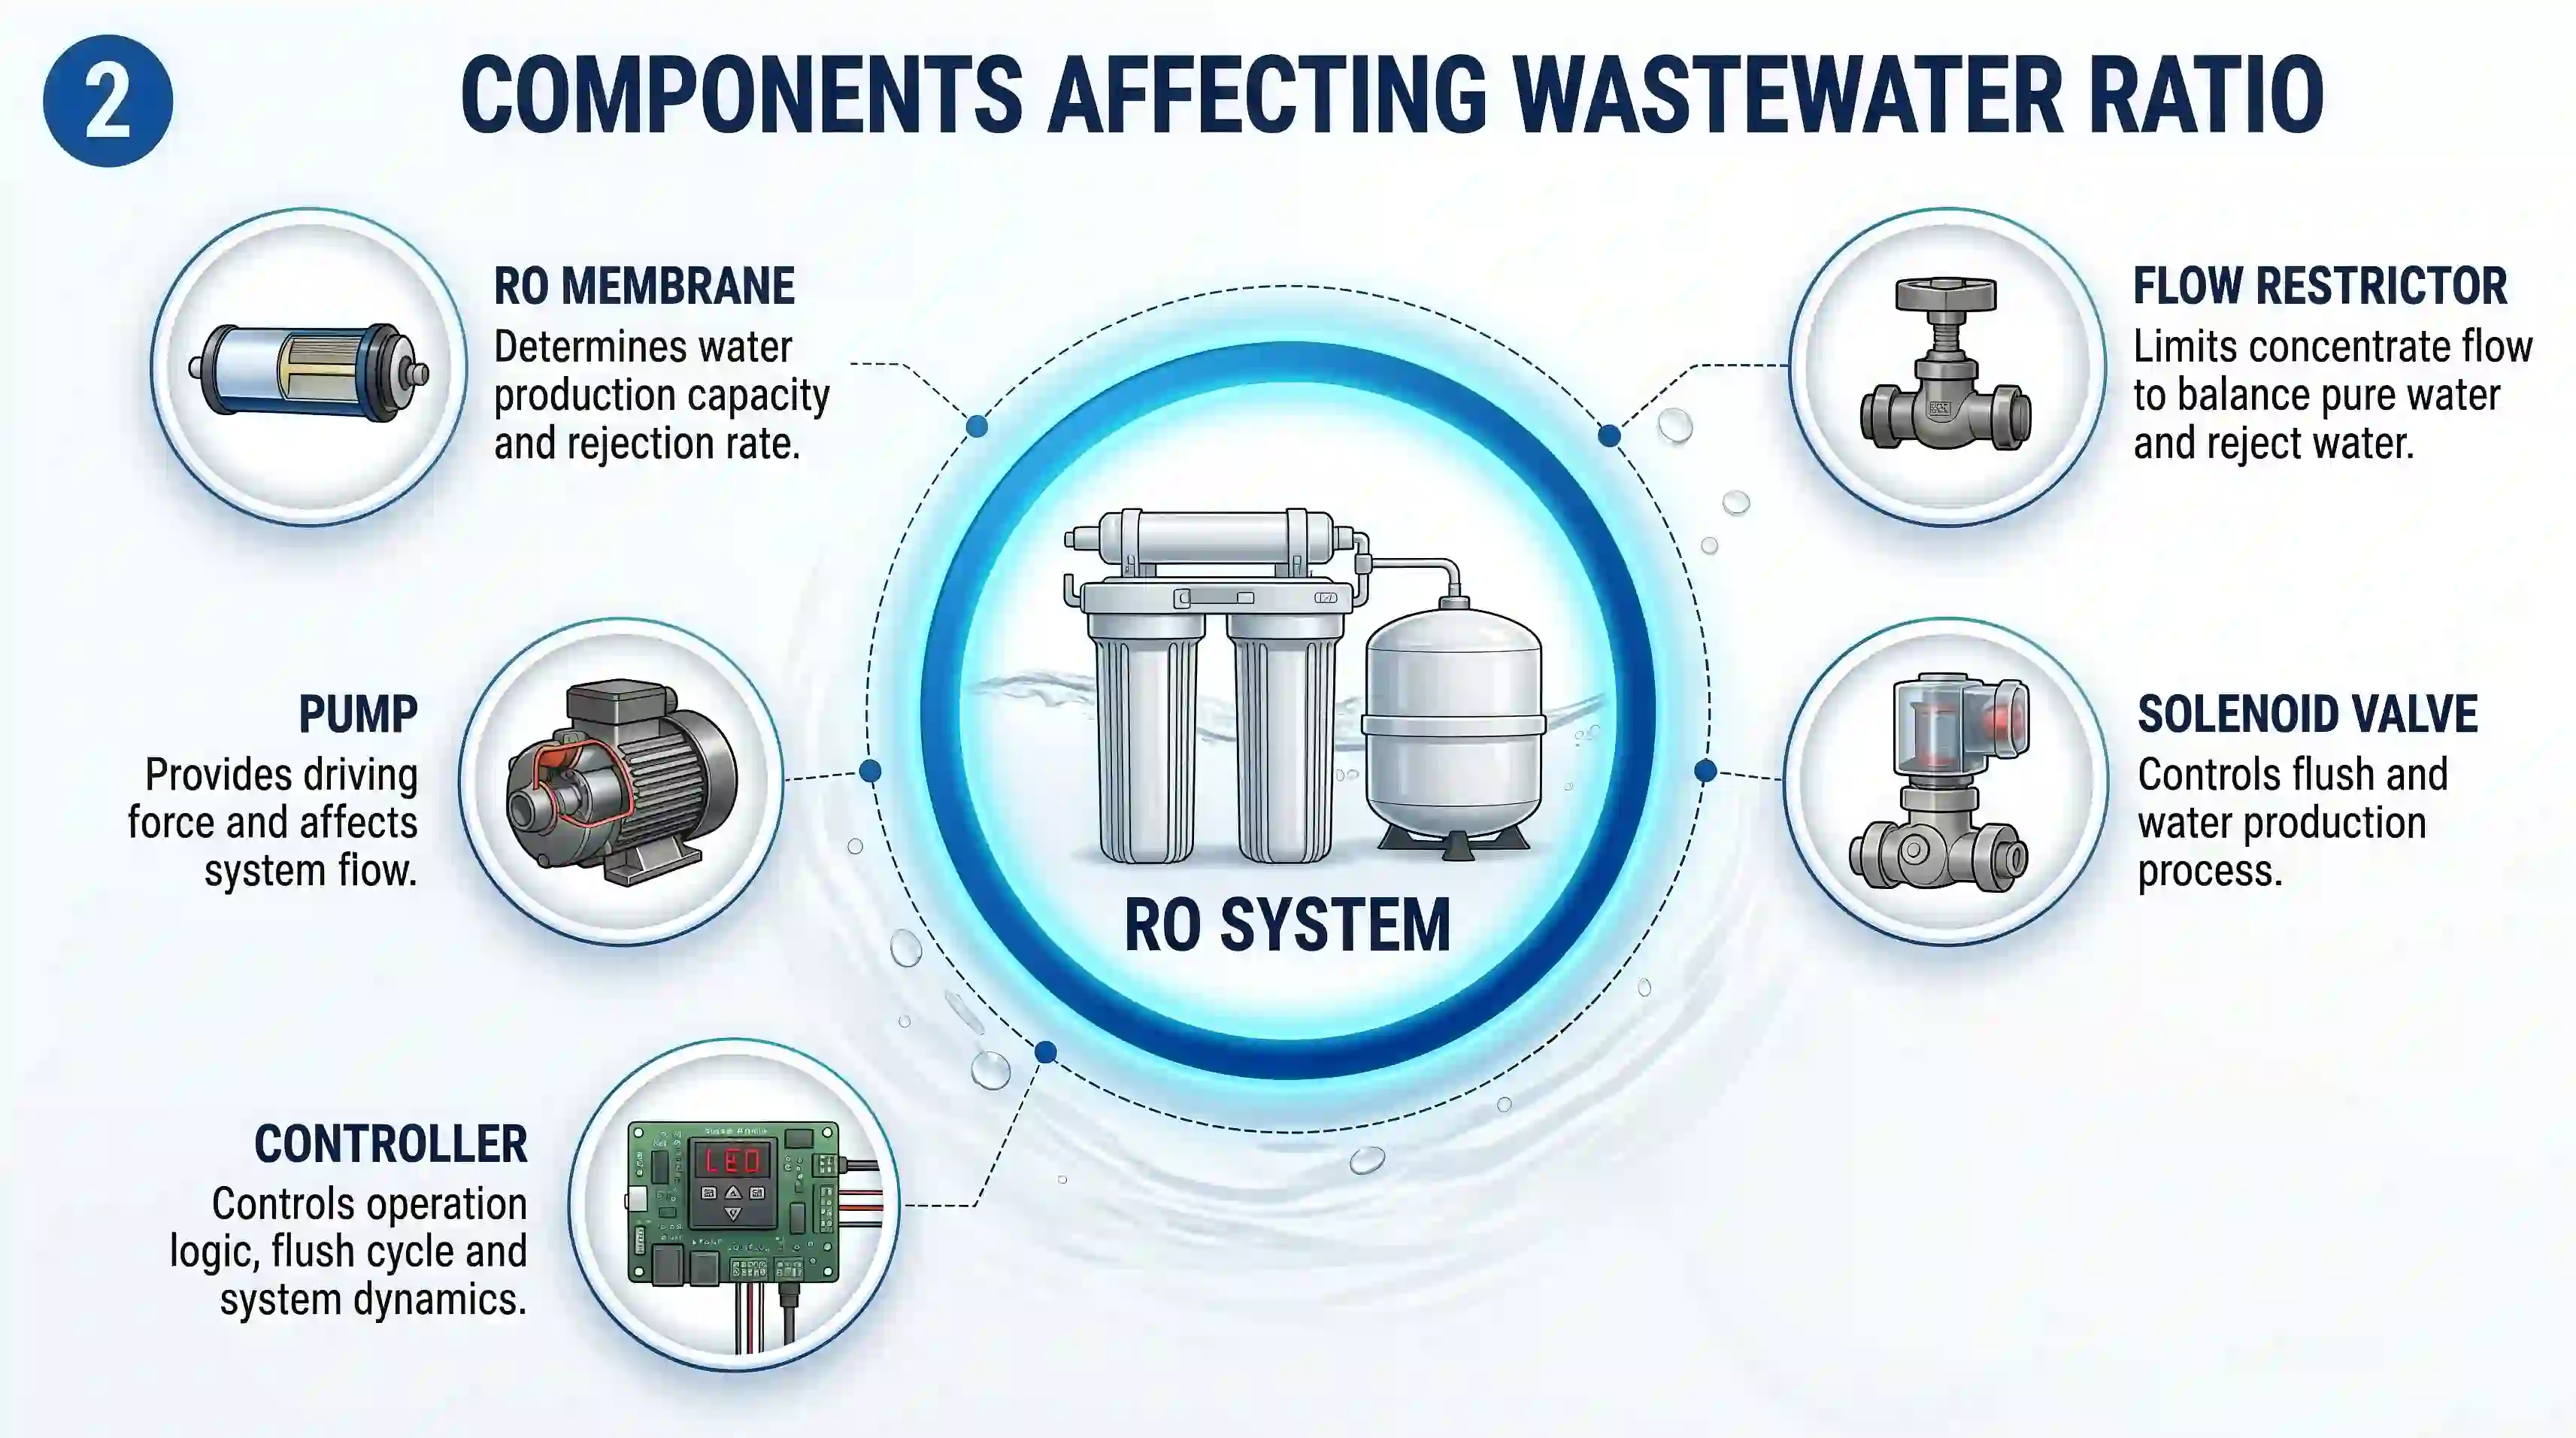
Core Components and Their Roles
| Component | Role in Wastewater Determination |
|---|---|
| RO Membrane | Its rejection rate and permeability directly determine how much water passes through vs. is rejected |
| Flow Restrictor | Creates backpressure in the reject line to control wastewater flow |
| Solenoid Valve | Manages the opening and closing of flush cycles |
| Booster Pump | Higher pressure = more permeate production = lower wastewater proportion |
| Controller (PCB) | Receives sensor data and coordinates valves, pump, and flush strategy |
System Coordination Logic
In a well-designed system, these components do not operate in isolation. The controller interprets data from pressure sensors and conductivity sensors. It then commands the pump, valves, and restrictor to work together.
The ultimate goal is to maintain the optimal balance among three factors:
-
Water production rate
-
Contaminant rejection rate
-
Membrane protection
Two Common Methods for Adjusting Wastewater Ratio
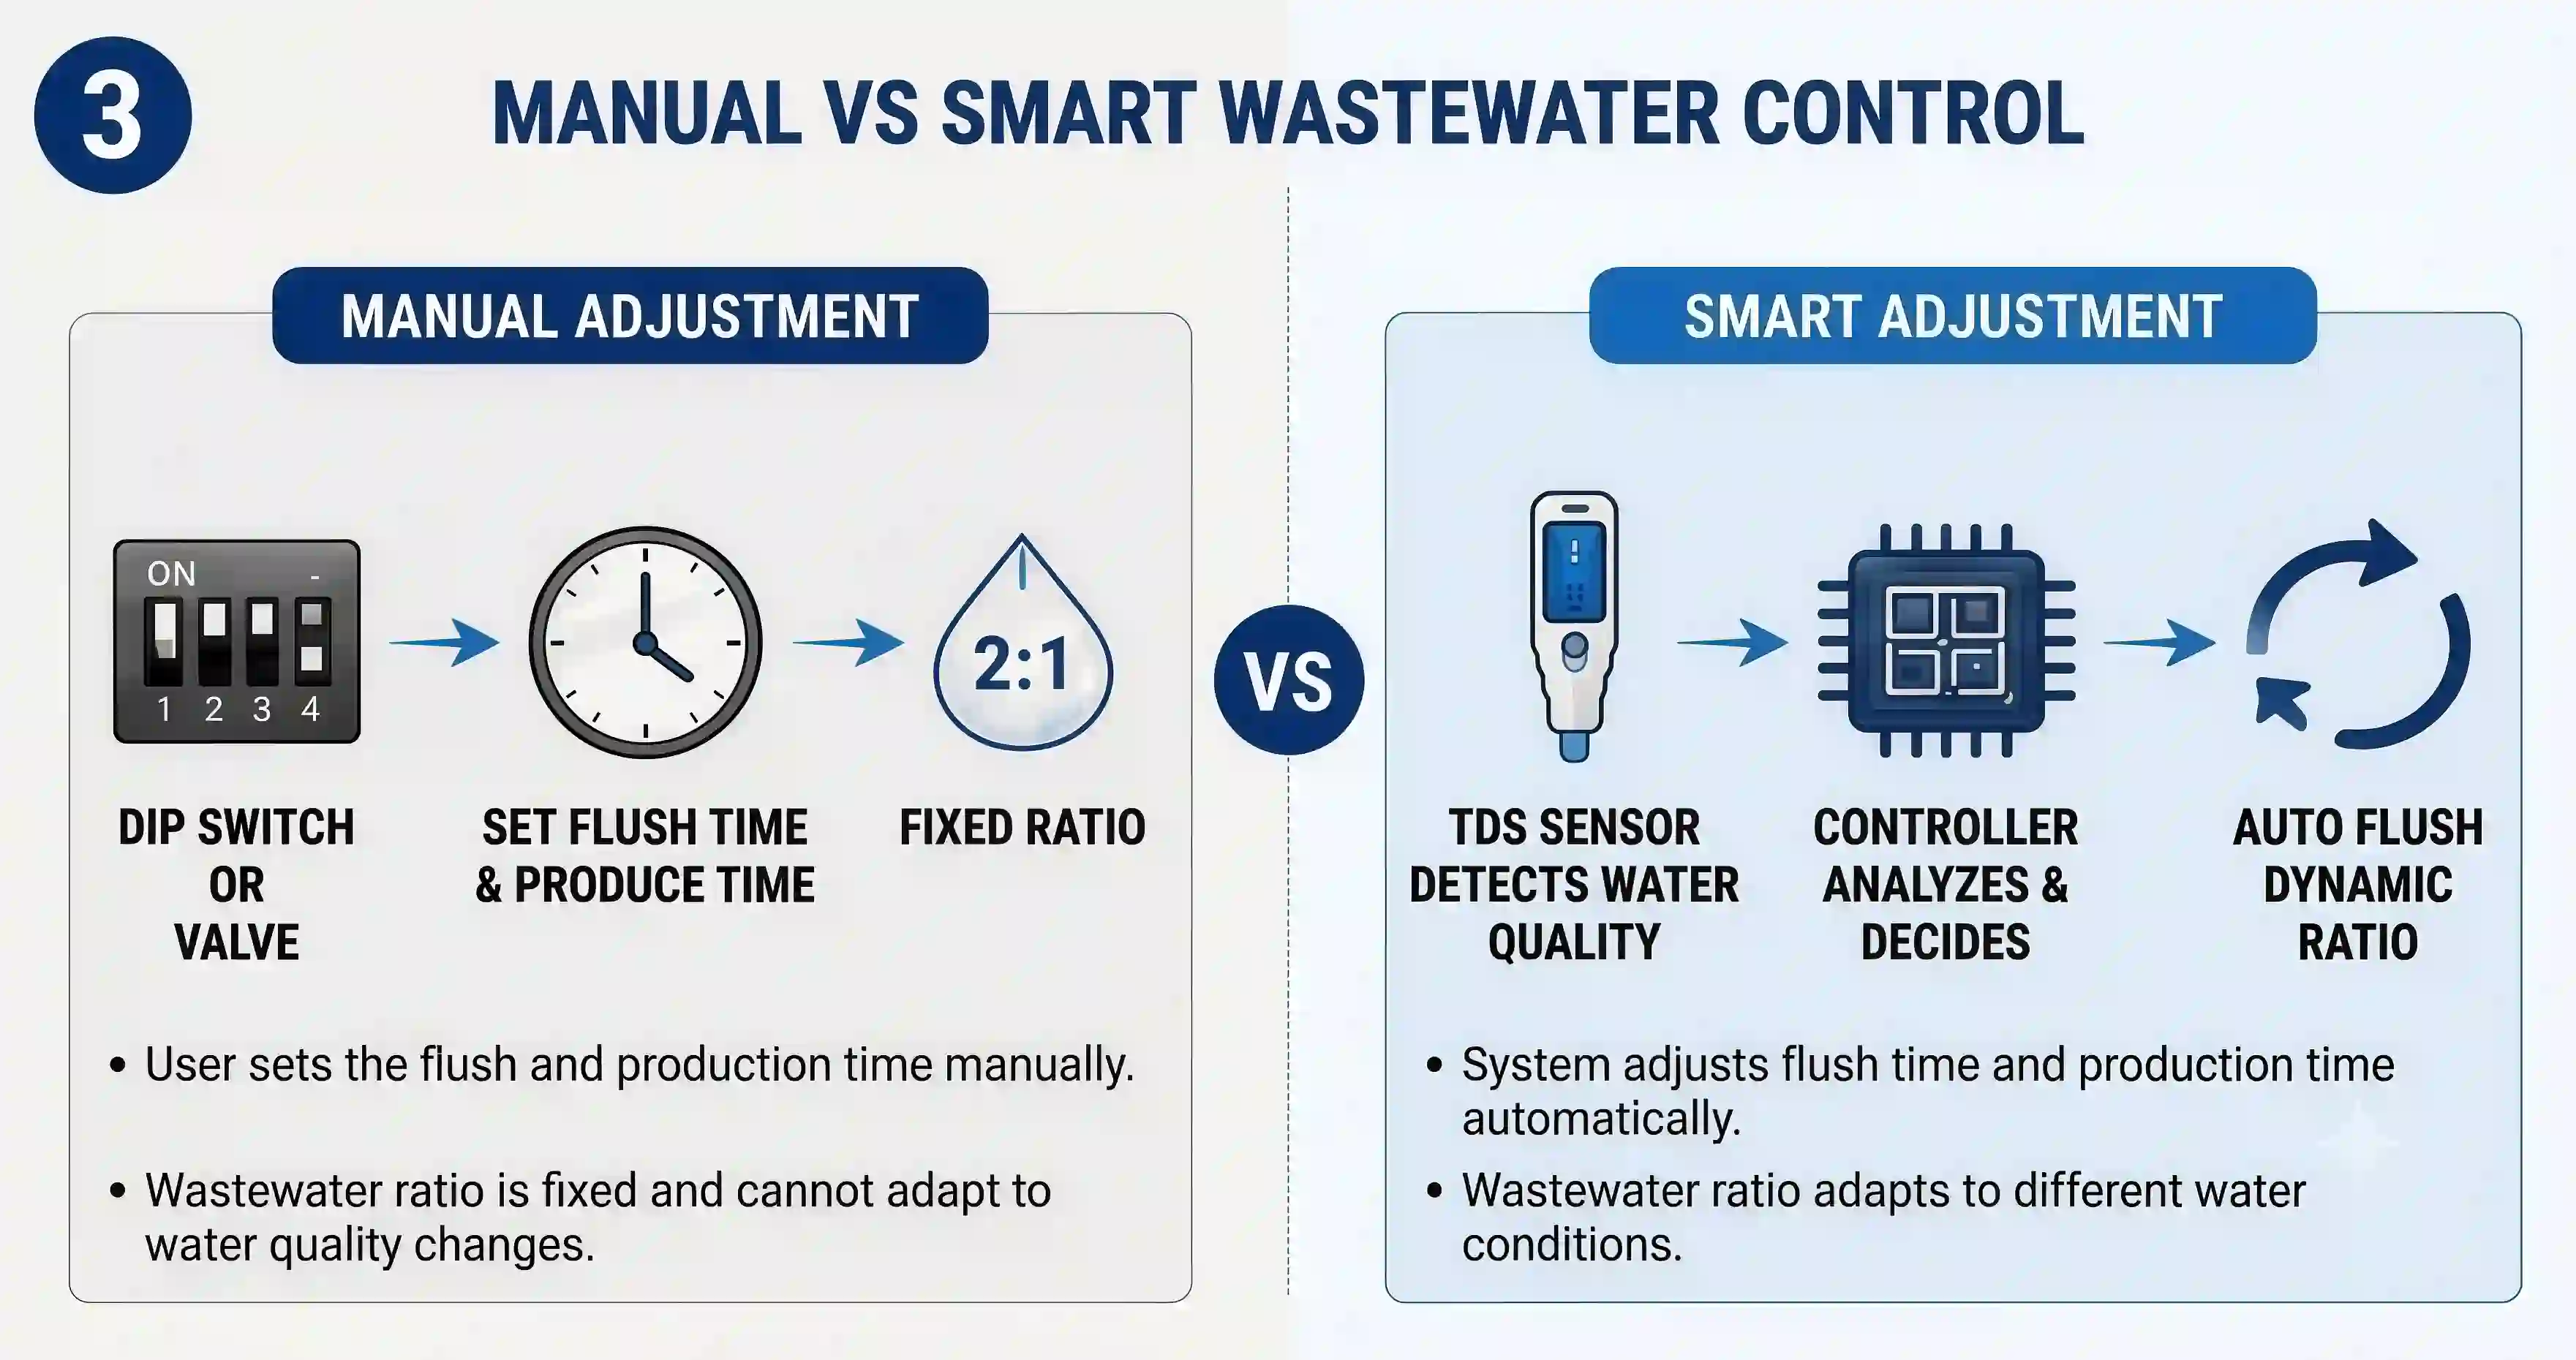
The industry has developed two fundamentally different approaches to wastewater adjustment. Each has its own use cases, advantages, and limitations.
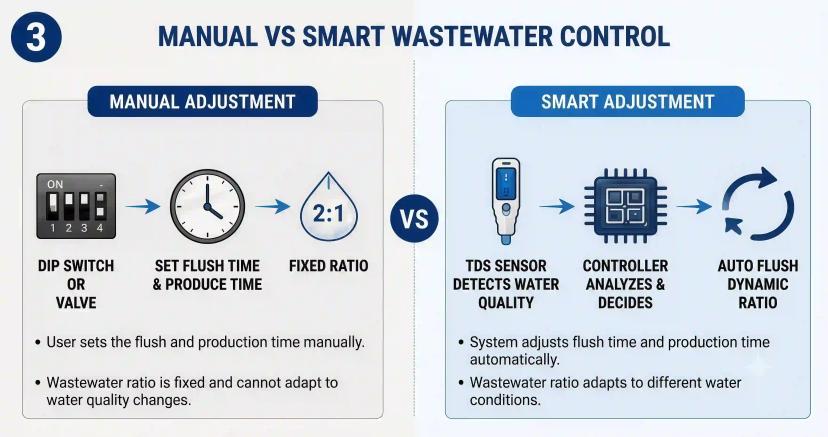
Manual Adjustment
In entry-level RO systems, the wastewater ratio is typically set at installation and remains unchanged thereafter.
Common Implementation Methods:
-
Fixed Flow Restrictor: Replace with a different specification to change the ratio
-
Needle Valve: Manually turn a knob to adjust flow resistance
-
DIP Switches: Select from pre-programmed time profiles (e.g., "produce 5 min, flush 17 sec")
Advantages:
-
Simple construction
-
Low failure rate
-
Low initial cost
Limitations:
-
Cannot adapt to changing water quality
-
Adjustment requires skilled personnel
-
Conservative settings waste water; aggressive settings may damage the membrane
Intelligent (Automatic) Adjustment
Modern mid-to-high-end RO systems have shifted to intelligent control.
How It Works:
-
TDS sensor measures the conductivity of incoming feed water
-
Controller compares the reading against programmed thresholds
-
Based on the TDS value, the system automatically adjusts operation strategy
Typical Control Logic:
| Feed TDS | Control Strategy | Target Recovery |
|---|---|---|
| < 200 ppm | Extend production, shorten flush | High (e.g., 2:1) |
| 200–500 ppm | Balance production and flush | Medium (1.5:1 to 2:1) |
| > 500 ppm | Shorten production, extend flush | Lower (1:1 to 1:2) |
Advantages of Intelligent Control:
-
Automatically optimizes water efficiency under varying feed conditions
-
Extends membrane life by increasing flush frequency when needed
-
Reduces wastewater discharge when water quality is good
-
Provides data logging and diagnostic capabilities
-
Lower total cost of ownership over the system lifetime
Limitations:
-
Higher initial cost
-
More components, more potential failure points
-
Relies on high-quality sensors for reliable operation
Why Does the Wastewater Ratio Change?
One of the most common questions from buyers and end-users: "Why is the wastewater ratio different today than it was yesterday?"
This is not a malfunction. This is the system responding normally to changes in its environment.
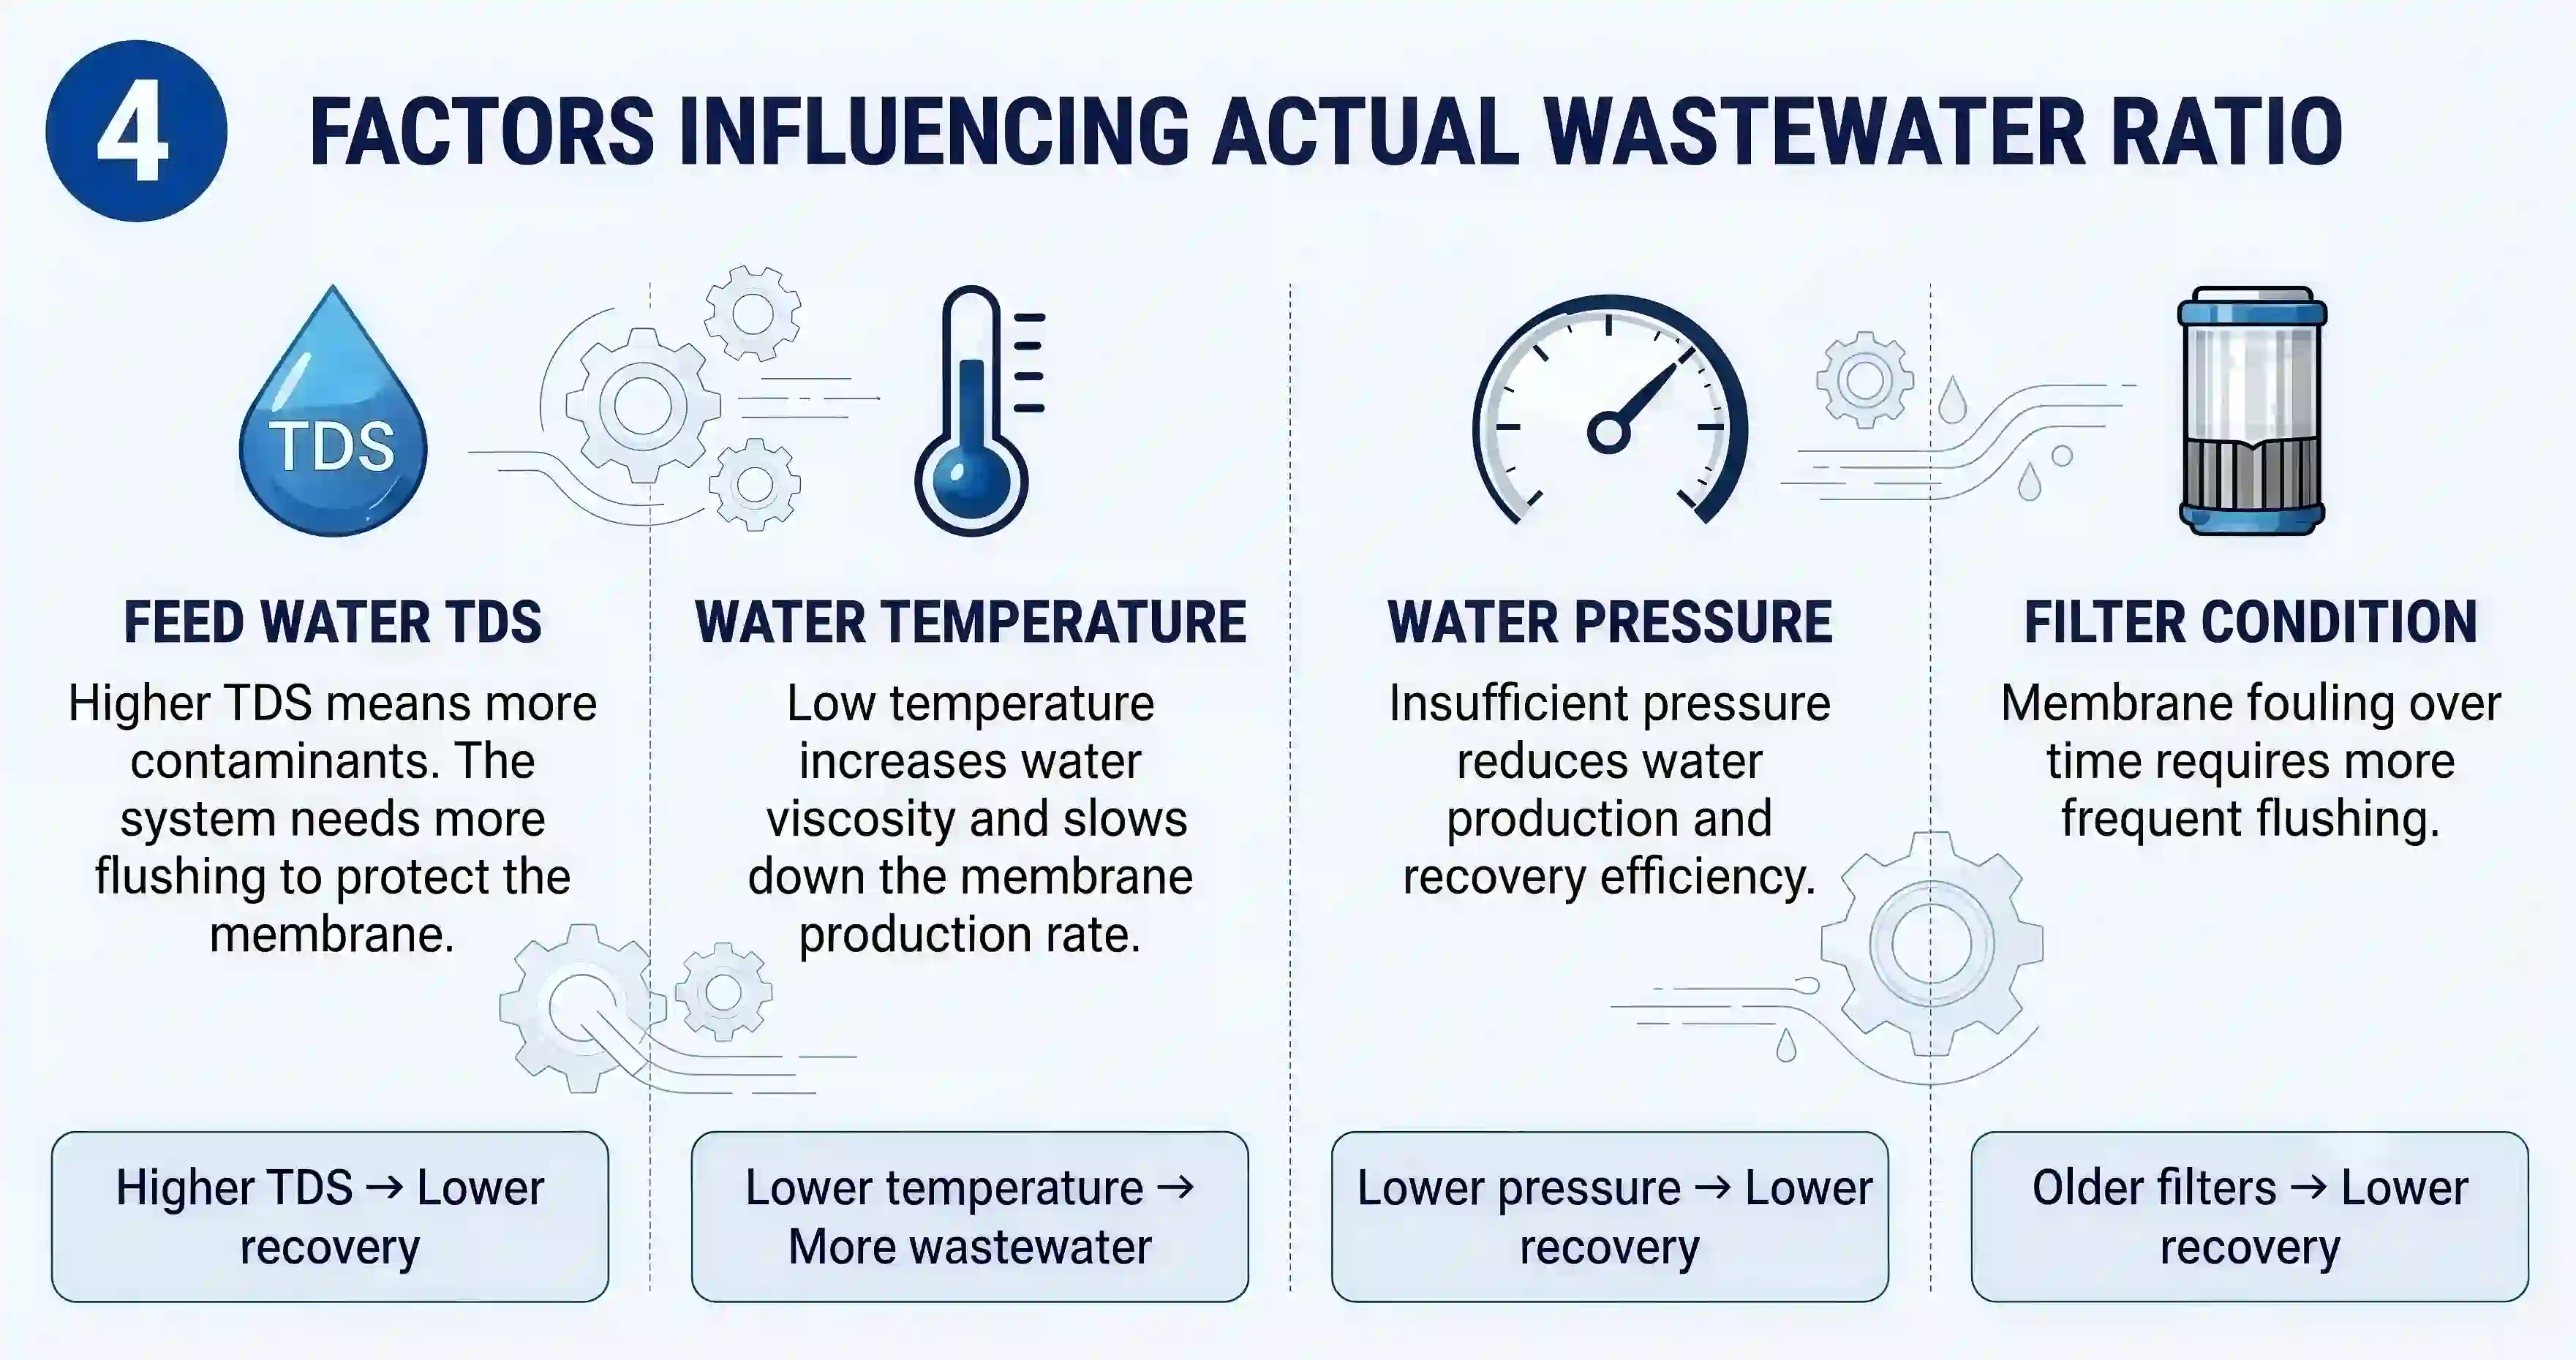
Four main factors cause the actual wastewater ratio to deviate from the nameplate specification.
1. Feed Water TDS
This is the single most influential factor.
-
Principle: Higher TDS = higher osmotic pressure = harder for the pump to push water through the membrane
-
Response: The controller increases flush frequency and duration to prevent salt precipitation (scaling) on the membrane surface
-
Real-world impact: A system rated at 2:1 on 150 ppm feed water may naturally settle at 1.2:1 when installed on 450 ppm feed water
2. Water Temperature
-
Principle: Lower temperature = higher water viscosity = slower flow through membrane pores
-
Response: Permeate flow rate drops, so wastewater proportion increases
-
Real-world impact: A 10°C seasonal temperature change can alter recovery rate by 15–20%
3. Inlet Water Pressure
Pressure can fluctuate due to:
-
Variations in municipal supply pressure
-
Clogged pre-filters
-
Pump wear or degradation
Impact: Lower pressure → less permeate → lower recovery. Excessively high pressure may increase recovery but accelerates membrane aging.
4. Membrane Condition and Age
-
Principle: As the RO membrane ages, its permeability gradually declines
-
Response: The system compensates by increasing flush frequency and duration
-
Real-world impact: After 2–3 years, recovery rate may be noticeably lower than when new—but this is still far more economical than premature failure due to scaling
Can Every RO Purifier Reach a 3:1 Ratio?
The short answer is: No.
At least not in real-world conditions, and certainly not consistently.
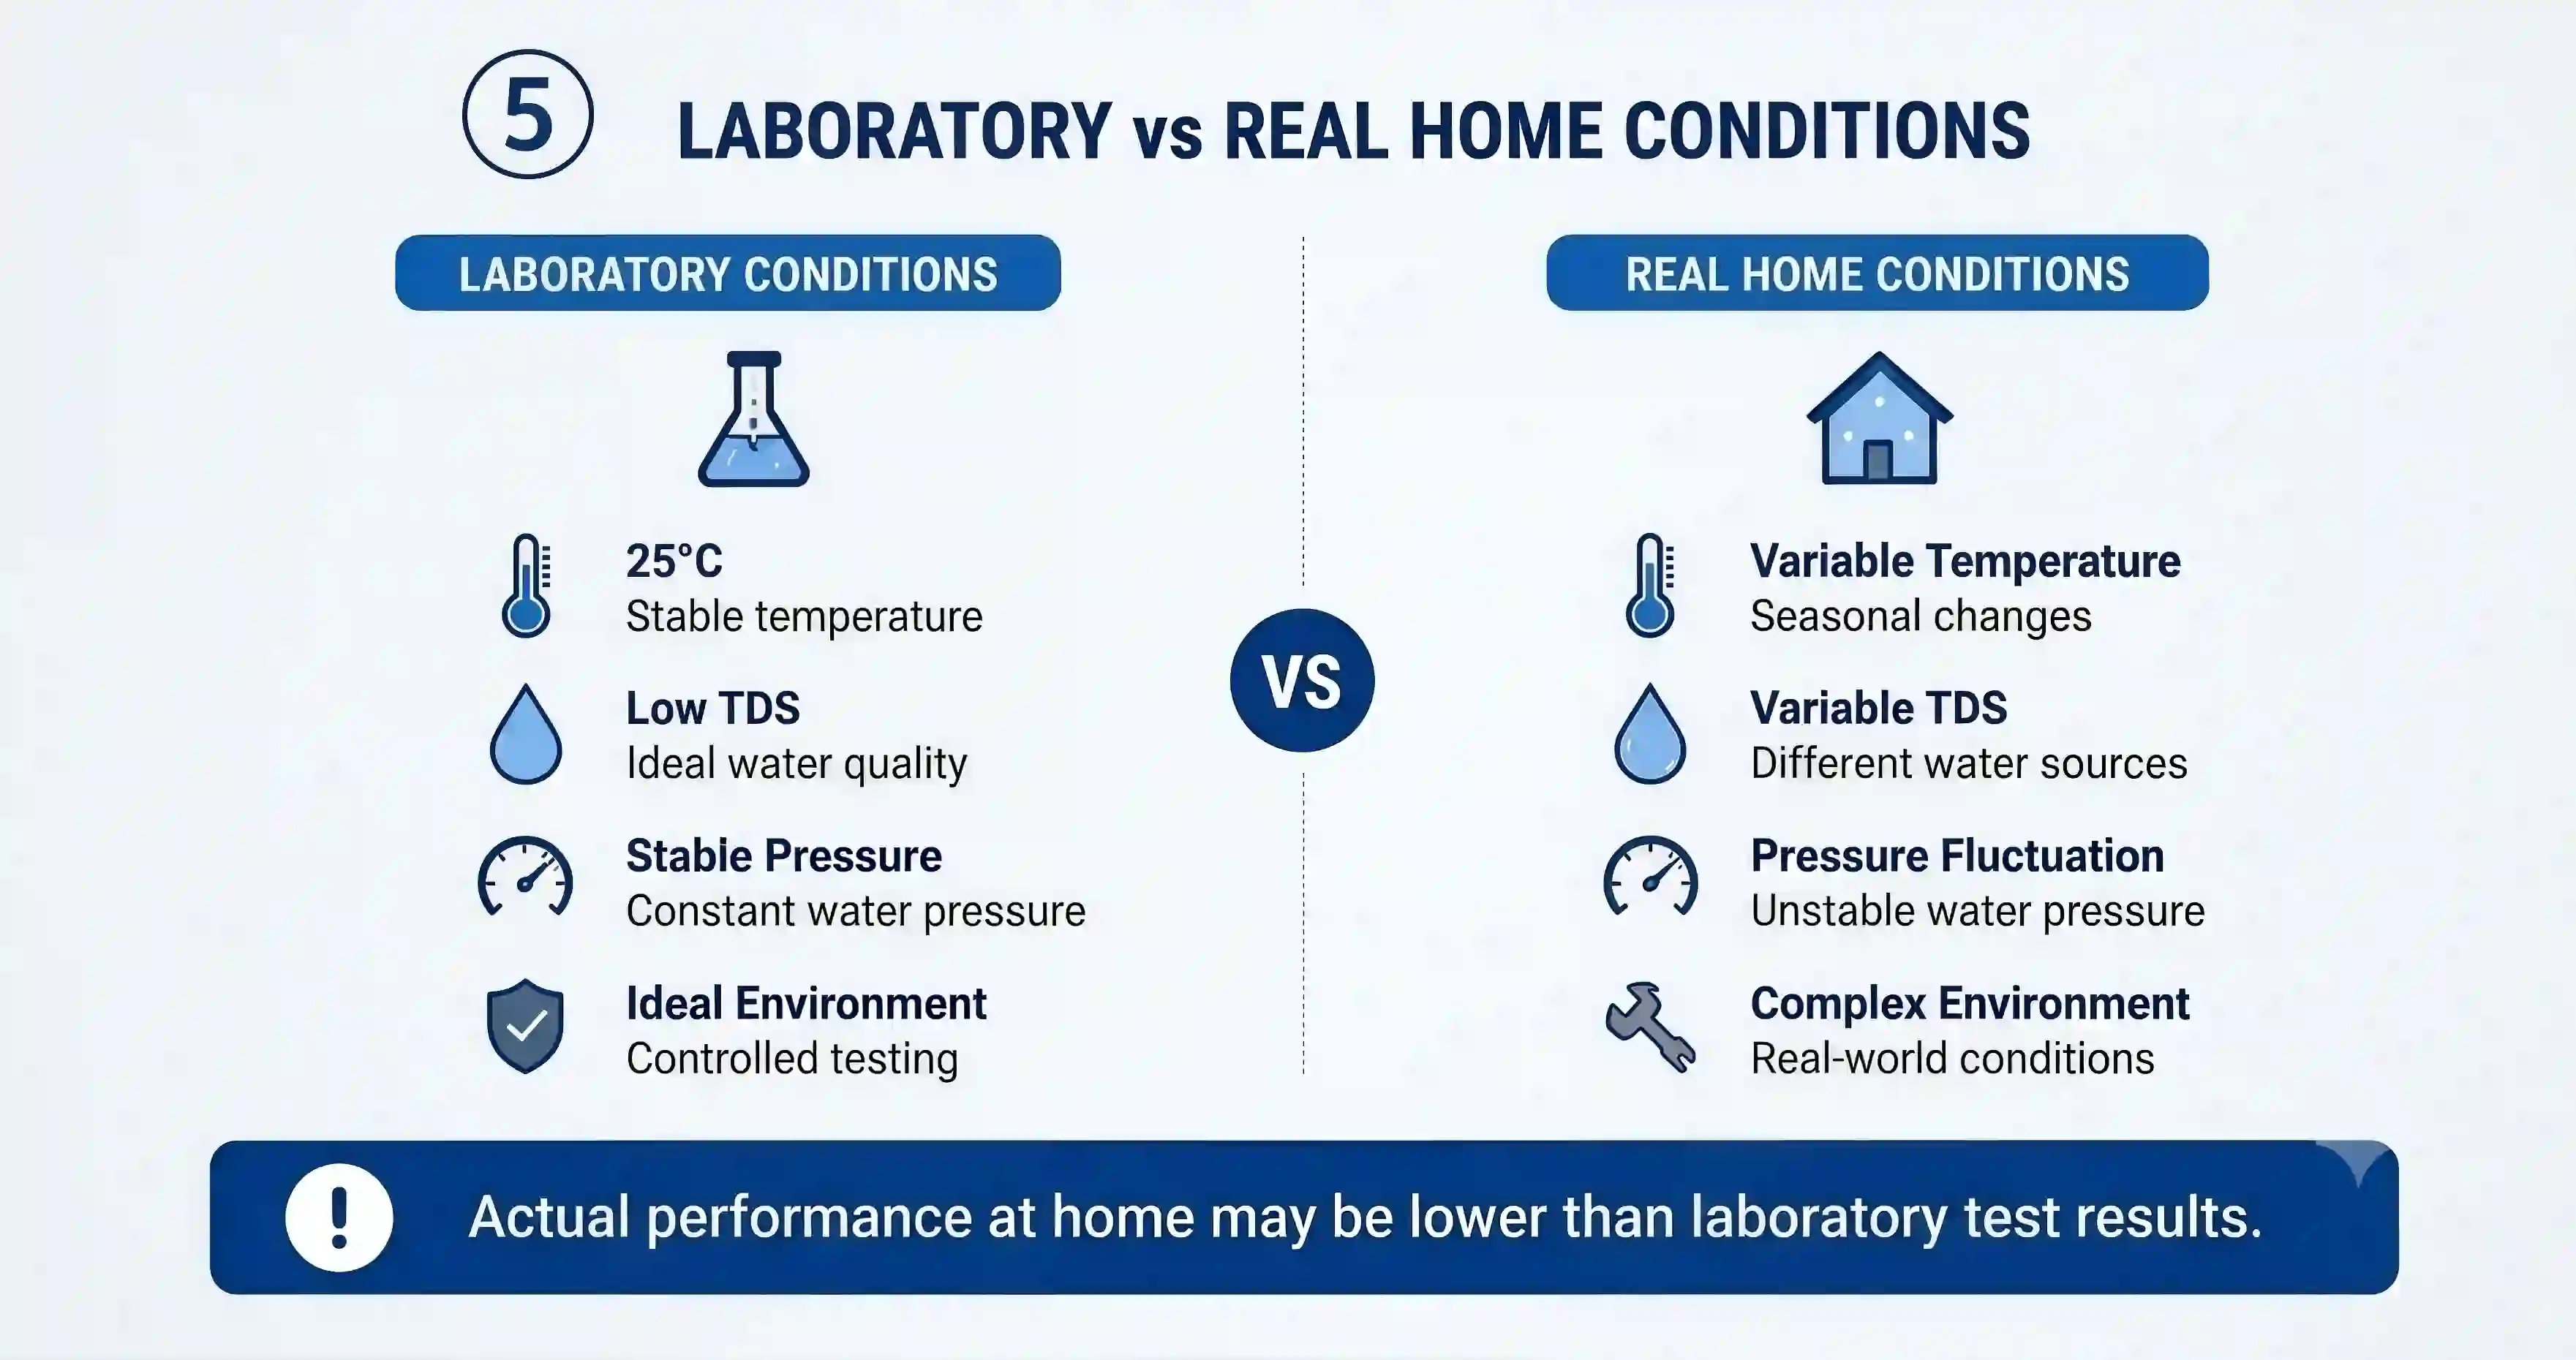
Laboratory Conditions
Performance testing is conducted under tightly controlled conditions:
-
Temperature: Maintained at 25°C ± 1°C (optimal for membrane permeability)
-
Feed water: Low TDS, typically 150–250 ppm
-
Pressure: Precisely regulated to the optimum value
-
Membrane: Brand new, at peak permeability
Under these ideal conditions, 3:1 recovery is achievable.
Real-World Household Conditions
In actual installations, the environment is far from ideal.
| Factor | Laboratory Condition | Typical Real-World Condition |
|---|---|---|
| Temperature | 25°C ± 1°C | 5–35°C, seasonal variation |
| Feed TDS | 150–250 ppm | 50–800 ppm, depending on source |
| Pressure | Stable and optimized | Fluctuates, affected by pre-filter condition |
| Membrane | Brand new | 1–5 years old, gradually aging |
Summary
A system rated at 3:1 in the laboratory typically delivers 1.8:1 to 2.2:1 in typical household installations—and even lower in regions with challenging feed water conditions.
This is not a product defect—it is physics.
Key questions for B2B buyers:
-
Is the supplier quoting laboratory data or expected field performance?
-
What water quality assumptions underlie the stated recovery figures?
Does Higher Recovery Always Mean Better?
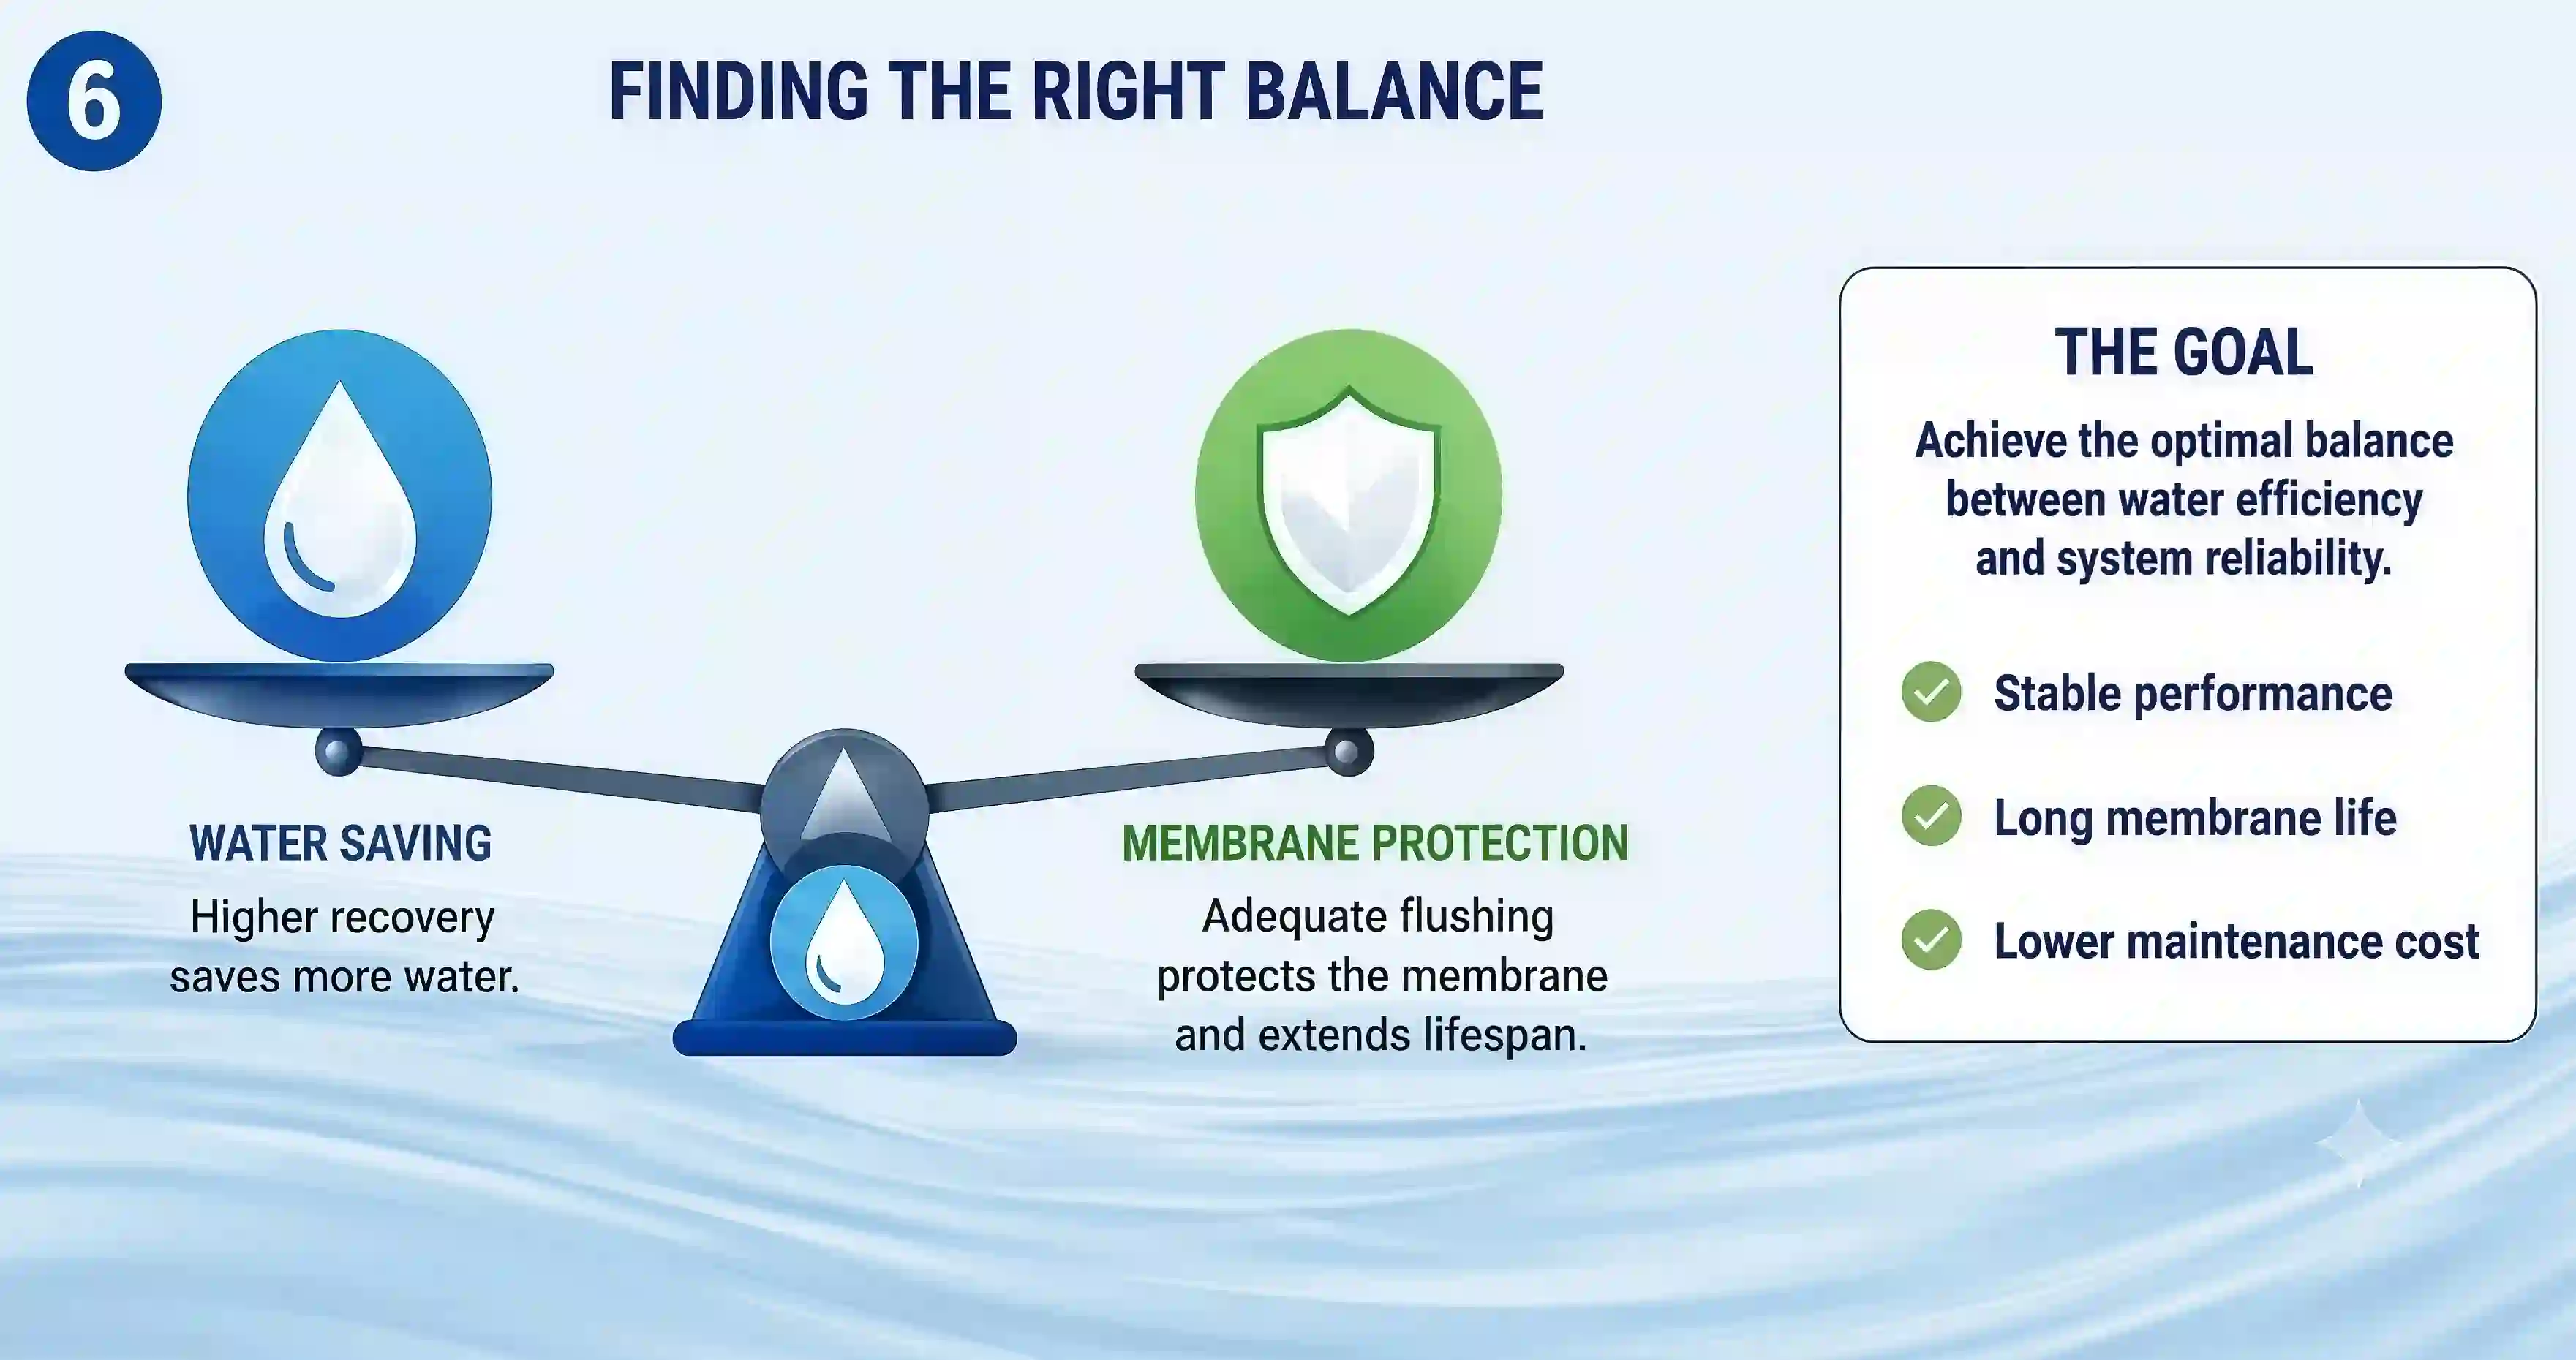
In commercial and industrial procurement, there is often a tendency to prioritize the highest possible recovery rate. But when considering total lifecycle economics, higher recovery is not always better.
The Core Trade-off
Higher recovery and membrane longevity are inherently in tension.
| Recovery Strategy | Water Efficiency | Scaling Risk | Flush Frequency | Membrane Life |
|---|---|---|---|---|
| Low (e.g., 1:1) | Lower | Very Low | Low | 5+ years |
| Medium (1.5:1–2:1) | Balanced | Low–Medium | Moderate | 3–5 years |
| High (3:1+) | Higher | Medium–High | High | 2–3 years |
The Cost of High Recovery
-
High recovery means the system retains more water and discharges less
-
This concentrates rejected contaminants on the feed side of the membrane
-
Increased scaling risk → blocked membrane pores → reduced permeate flow
-
The system compensates with more aggressive flushing → long-term wastewater actually increases
-
Severe scaling permanently damages the membrane, requiring early replacement
The Real Economics
For a typical household consuming 10 litres of purified water per day:
-
Difference between 2:1 and 3:1 system = 1.8 litres less wastewater per day
-
= approximately 650 litres per year
-
= less than $2 per year in water savings
Meanwhile, a premium RO membrane element costs $50–$150 to replace. If aggressive settings shorten membrane life by even 6–12 months, the economics reverse completely.
B2B Procurement Recommendations by Application Scenario
Different applications require different approaches to wastewater ratio selection. Below are specific recommendations for common B2B use cases.
1. Residential Point-of-Use (POU) Systems
| Consideration | Recommendation |
|---|---|
| Priority | Balanced recovery with intelligent control |
| Target Ratio | 1.5:1 to 2:1 |
| Rationale | End-users value both water efficiency and long filter life. A moderate ratio minimizes service calls and maximizes customer satisfaction. |
| Key Feature | TDS-based automatic adjustment |
2. Light Commercial (Offices, Restaurants, Retail)
| Consideration | Recommendation |
|---|---|
| Priority | Reliability and consistent performance |
| Target Ratio | 1.5:1 to 2:1 with robust flush cycles |
| Rationale | Higher usage volume means membrane protection is critical. Downtime is costly. Prioritize systems with diagnostic capabilities. |
| Key Feature | Pressure compensation and temperature monitoring |
3. Industrial Processing (Manufacturing, Boiler Feed, Electronics)
| Consideration | Recommendation |
|---|---|
| Priority | Consistent water quality over water efficiency |
| Target Ratio | 1:1 to 1.5:1 |
| Rationale | Process quality depends on stable permeate quality. Conservative recovery ensures membrane integrity and consistent rejection rates. |
| Key Feature | Multi-parameter monitoring (TDS, pressure, flow, temperature) |
4. Agricultural / Irrigation Applications
| Consideration | Recommendation |
|---|---|
| Priority | Water conservation and low operating cost |
| Target Ratio | Up to 2:1 where water quality permits |
| Rationale | Large water volumes mean even small efficiency gains matter. However, membrane replacement costs scale with system size, so balance remains important. |
| Key Feature | Variable recovery based on seasonal water quality changes |
5. OEM / White-Label Manufacturing
| Consideration | Recommendation |
|---|---|
| Priority | Flexibility and configurable control parameters |
| Target Ratio | Programmable, customer-specified |
| Rationale | Different end-markets have different expectations. A platform with configurable recovery profiles allows one hardware design to serve multiple regions and applications. |
| Key Feature | Firmware-adjustable flush logic and recovery targets |
6. Hospitality (Hotels, Resorts, Large Kitchens)
| Consideration | Recommendation |
|---|---|
| Priority | Low maintenance and high uptime |
| Target Ratio | 1.5:1 to 2:1 with redundant components where possible |
| Rationale | Service interruptions directly impact guest experience. Systems with automatic alerts and self-diagnostics are preferred. |
| Key Feature | Remote monitoring and fault notification |
Q&A
The following question-and-answer pairs are optimized for Google's "People Also Ask" and featured snippet boxes, helping your content capture search traffic at multiple stages of the buyer journey.
Q1: What is the wastewater ratio in an RO water purifier?
The wastewater ratio in an RO water purifier refers to the proportion of feed water that is rejected as waste compared to the amount of purified water produced. For example, a 2:1 ratio means the system produces 2 litres of purified water for every 1 litre of wastewater. However, this ratio is not fixed—it varies dynamically based on feed water quality, temperature, pressure, and membrane condition.
Q2: How is the wastewater ratio adjusted in an RO system?
The wastewater ratio is adjusted either manually or automatically. Manual adjustment uses fixed flow restrictors, needle valves, or DIP switches to set a constant ratio at installation. Intelligent adjustment uses TDS sensors and a controller to dynamically alter production and flush cycles based on real-time feed water quality, automatically optimizing the ratio for current conditions.
Q3: What is a good wastewater ratio for an RO purifier?
A good wastewater ratio depends on your application and water quality. For most residential applications, 1.5:1 to 2:1 provides an optimal balance between water efficiency and membrane life. In areas with very hard water (TDS > 500 ppm), a lower ratio of 1:1 to 1.5:1 is recommended to protect the membrane from scaling and extend its service life.
Q4: Can an RO system really achieve a 3:1 wastewater ratio?
Yes, but only under ideal laboratory conditions—typically 25°C water temperature, low TDS feed water (150–250 ppm), stable pressure, and a brand-new membrane. In real-world household or commercial installations, the same system will typically deliver 1.8:1 to 2.2:1. A 3:1 claim should be understood as a theoretical maximum, not a guaranteed everyday performance figure.
Q5: Why does my RO wastewater ratio change over time?
The wastewater ratio changes due to four primary factors: feed water TDS (higher TDS increases scaling risk, requiring more flushing), water temperature (colder water reduces permeate flow), inlet pressure fluctuations, and membrane aging (older membranes lose permeability, triggering more frequent flush cycles). These variations are normal and indicate the system is actively protecting the membrane.
Q6: Does a higher wastewater ratio mean better RO performance?
Not necessarily. Higher recovery ratios reduce water waste but increase contaminant concentration on the feed side of the membrane, raising scaling risk and potentially shortening membrane life. A moderate, well-balanced ratio that prioritizes membrane protection often delivers lower total cost of ownership than aggressively chasing the highest possible recovery figure.
Q7: What is the difference between manual and smart wastewater control?
Manual control uses fixed mechanical components or pre-set timers to maintain a constant ratio regardless of water quality changes. Smart control uses TDS sensors and an electronic controller to monitor feed water in real time and dynamically adjust production and flush cycles. Smart control adapts to changing conditions, extending membrane life and optimizing water efficiency across varying water quality scenarios.
Q8: How do I choose the right RO system for my application?
Start by evaluating your feed water quality (TDS range, temperature, pressure stability), usage volume, and maintenance capabilities. For residential and light commercial use, prioritize intelligent control with TDS-based adjustment. For industrial applications, prioritize consistent permeate quality and robust flushing cycles. Request performance data at multiple TDS levels and review total cost of ownership, not just initial purchase price or recovery ratio.
Choosing an RO System: What Matters Most?
For procurement professionals, brand managers, and engineers, the following criteria are more meaningful than any single recovery figure.
✔ Stable and Predictable Recovery
A system that delivers consistent performance across a defined range of conditions is preferable to one that claims a high ratio but cannot maintain it.
Recommendation: Request specifications that include recovery figures at multiple TDS levels and temperatures.
✔ Intelligent Control with Sensor Feedback
Systems equipped with TDS sensors and adaptive algorithms automatically protect themselves and users from water quality fluctuations.
This delivers:
-
Fewer warranty claims
-
Higher user satisfaction
-
Extended maintenance intervals
✔ Robust Flushing Strategy
Effective flushing is the most important factor in membrane preservation.
Evaluation points:
-
Is flushing triggered by time, by TDS threshold, or both?
-
Are flush duration and frequency configurable?
✔ Low Maintenance Burden
Considerations:
-
Are pre-filters standard and readily available?
-
Can the membrane element be replaced without special tools?
-
Does the controller provide diagnostic information for service technicians?
✔ Transparency in Operating Conditions
Reputable suppliers will clearly state the conditions under which their recovery figures are achievable.
Request: Performance matrices at multiple TDS levels, pressure ranges, and temperatures.
A supplier that provides comprehensive performance data is more trustworthy than one that offers only a single best-case figure.
✔ Total Cost of Ownership (TCO)
Don't focus solely on initial purchase price or a single efficiency metric.
Model the full lifecycle:
-
Membrane replacement intervals
-
Pre-filter consumption
-
Energy consumption
-
Water costs
-
Expected service frequency
A system with a modest recovery rate but long membrane life and low maintenance often wins on TCO.
Conclusion
The wastewater ratio of an RO water purifier is not a fixed value. It is a dynamic result of system design, operating conditions, and water quality.
Core Technical Summary
Understanding the wastewater ratio requires looking beyond the marketing headline. The ratio is shaped by the physical interaction of five key components: the RO membrane, flow restrictor, solenoid valve, booster pump, and electronic controller. These components work together under the supervision of a control logic that balances production, rejection, and protection.
The ratio changes continuously in response to feed water TDS, temperature, pressure, and membrane age. A system that produces 2:1 today may produce 1.6:1 tomorrow—and that is not a flaw, but a sign that the system is actively managing membrane health.
The 3:1 Reality Check
The widely marketed 3:1 ratio is achievable only under ideal laboratory conditions: 25°C water, low TDS feed, stable pressure, and a brand-new membrane. In real-world installations, the same system typically delivers 1.8:1 to 2.2:1, or lower in challenging water conditions. B2B buyers should treat laboratory figures as theoretical ceilings, not performance guarantees.
Manual vs. Intelligent Control
Manual adjustment offers simplicity and low upfront cost but cannot adapt to changing water quality, making it suitable only for stable, predictable feed water conditions. Intelligent control, while more expensive initially, provides adaptive responsiveness that optimizes water efficiency, extends membrane life, and reduces long-term operating costs. For most commercial and industrial applications, the total cost of ownership of an intelligent system is lower over a 3–5 year horizon.
The Recovery Trade-off
Higher recovery does not mean better performance. Aggressive recovery settings concentrate contaminants on the membrane surface, increasing scaling risk, driving more frequent flushing, and shortening membrane life. The water saved by moving from 2:1 to 3:1 amounts to less than $2 per year for a typical household—while the membrane replacement cost can be $50–$150 if life is shortened by even 6–12 months. The optimal strategy is to balance recovery with protection, not maximize it.
Procurement Decision Framework
For B2B buyers, the decision should rest on six criteria:
-
Stable recovery across specified operating conditions
-
Intelligent control with TDS sensor feedback
-
Robust flushing strategy that protects the membrane
-
Low maintenance burden with accessible components
-
Transparency in supplier performance data
-
Total cost of ownership over the full lifecycle
Different applications demand different priorities. Residential systems benefit from balanced recovery with intelligent control. Industrial applications require consistent water quality and conservative recovery. OEM manufacturers need configurable platforms that can serve multiple markets. Agricultural users may prioritize water conservation but must still account for membrane replacement costs at scale.
Strategic Implications for Buyers
The most sophisticated RO systems are not those that achieve the highest single number on a datasheet, but those that intelligently balance multiple competing objectives: water efficiency, membrane longevity, consistent water quality, and operational simplicity.
When evaluating suppliers, look for:
-
Willingness to provide data across a range of operating conditions, not just best-case scenarios
-
Clear documentation of flush strategy and control logic
-
Transparency about the gap between laboratory and field performance
-
Service and support infrastructure that matches your geographic footprint
The cost of an RO system is not the purchase price—it is the total cost of delivering reliable, high-quality water over 5–10 years. A system that costs slightly more upfront but delivers consistent performance, long membrane life, and low maintenance will almost always be more economical than a cheaper system that requires frequent service, premature membrane replacement, or produces inconsistent water quality.
Final Thought
A well-designed control strategy that intelligently balances recovery with membrane protection is almost always more valuable than any single headline number. In a market crowded with competitive claims, the buyer who understands the underlying engineering—who knows what questions to ask and what data to demand—will make decisions that deliver superior value over the long term.
For engineers, buyers, and brand owners, the most prudent approach is to evaluate RO systems holistically: examine the control strategy, understand the performance trade-offs, and model the total lifecycle cost. The system that wins on all three dimensions is the one worth specifying.
This guide is intended for professional buyers, engineers, and specifiers of RO water purification systems. For application-specific advice, consult with your system supplier or a qualified water treatment engineer.